Land Lost to ALC Applications in Greater Vancouver
A kernel density analysis of 157 Agricultural Land Commission applications, showing that farmland in Metro Vancouver is being consumed by approved houses rather than by exclusions from the reserve.
- Year
- 2023
- Context
- GEOG 4380, Kwantlen Polytechnic University, following an internship at the Agricultural Land Commission
- Role
- Sole analyst and cartographer
- Tools
- ArcMap, Kernel Density, ALC Application Portal, ParcelMap BC
The question
Most public argument about the Agricultural Land Reserve is about exclusions, the applications that formally remove land from the reserve. That framing assumes exclusions are where farmland is lost.
After a term interning at the Agricultural Land Commission, I suspected the more consequential mechanism was quieter: non-adhering residential use (NARU) applications, which don’t remove land from the ALR at all. They just approve a house on it, or a bigger house than the one already there.
So: where is agricultural land in Metro Vancouver actually going?
Method
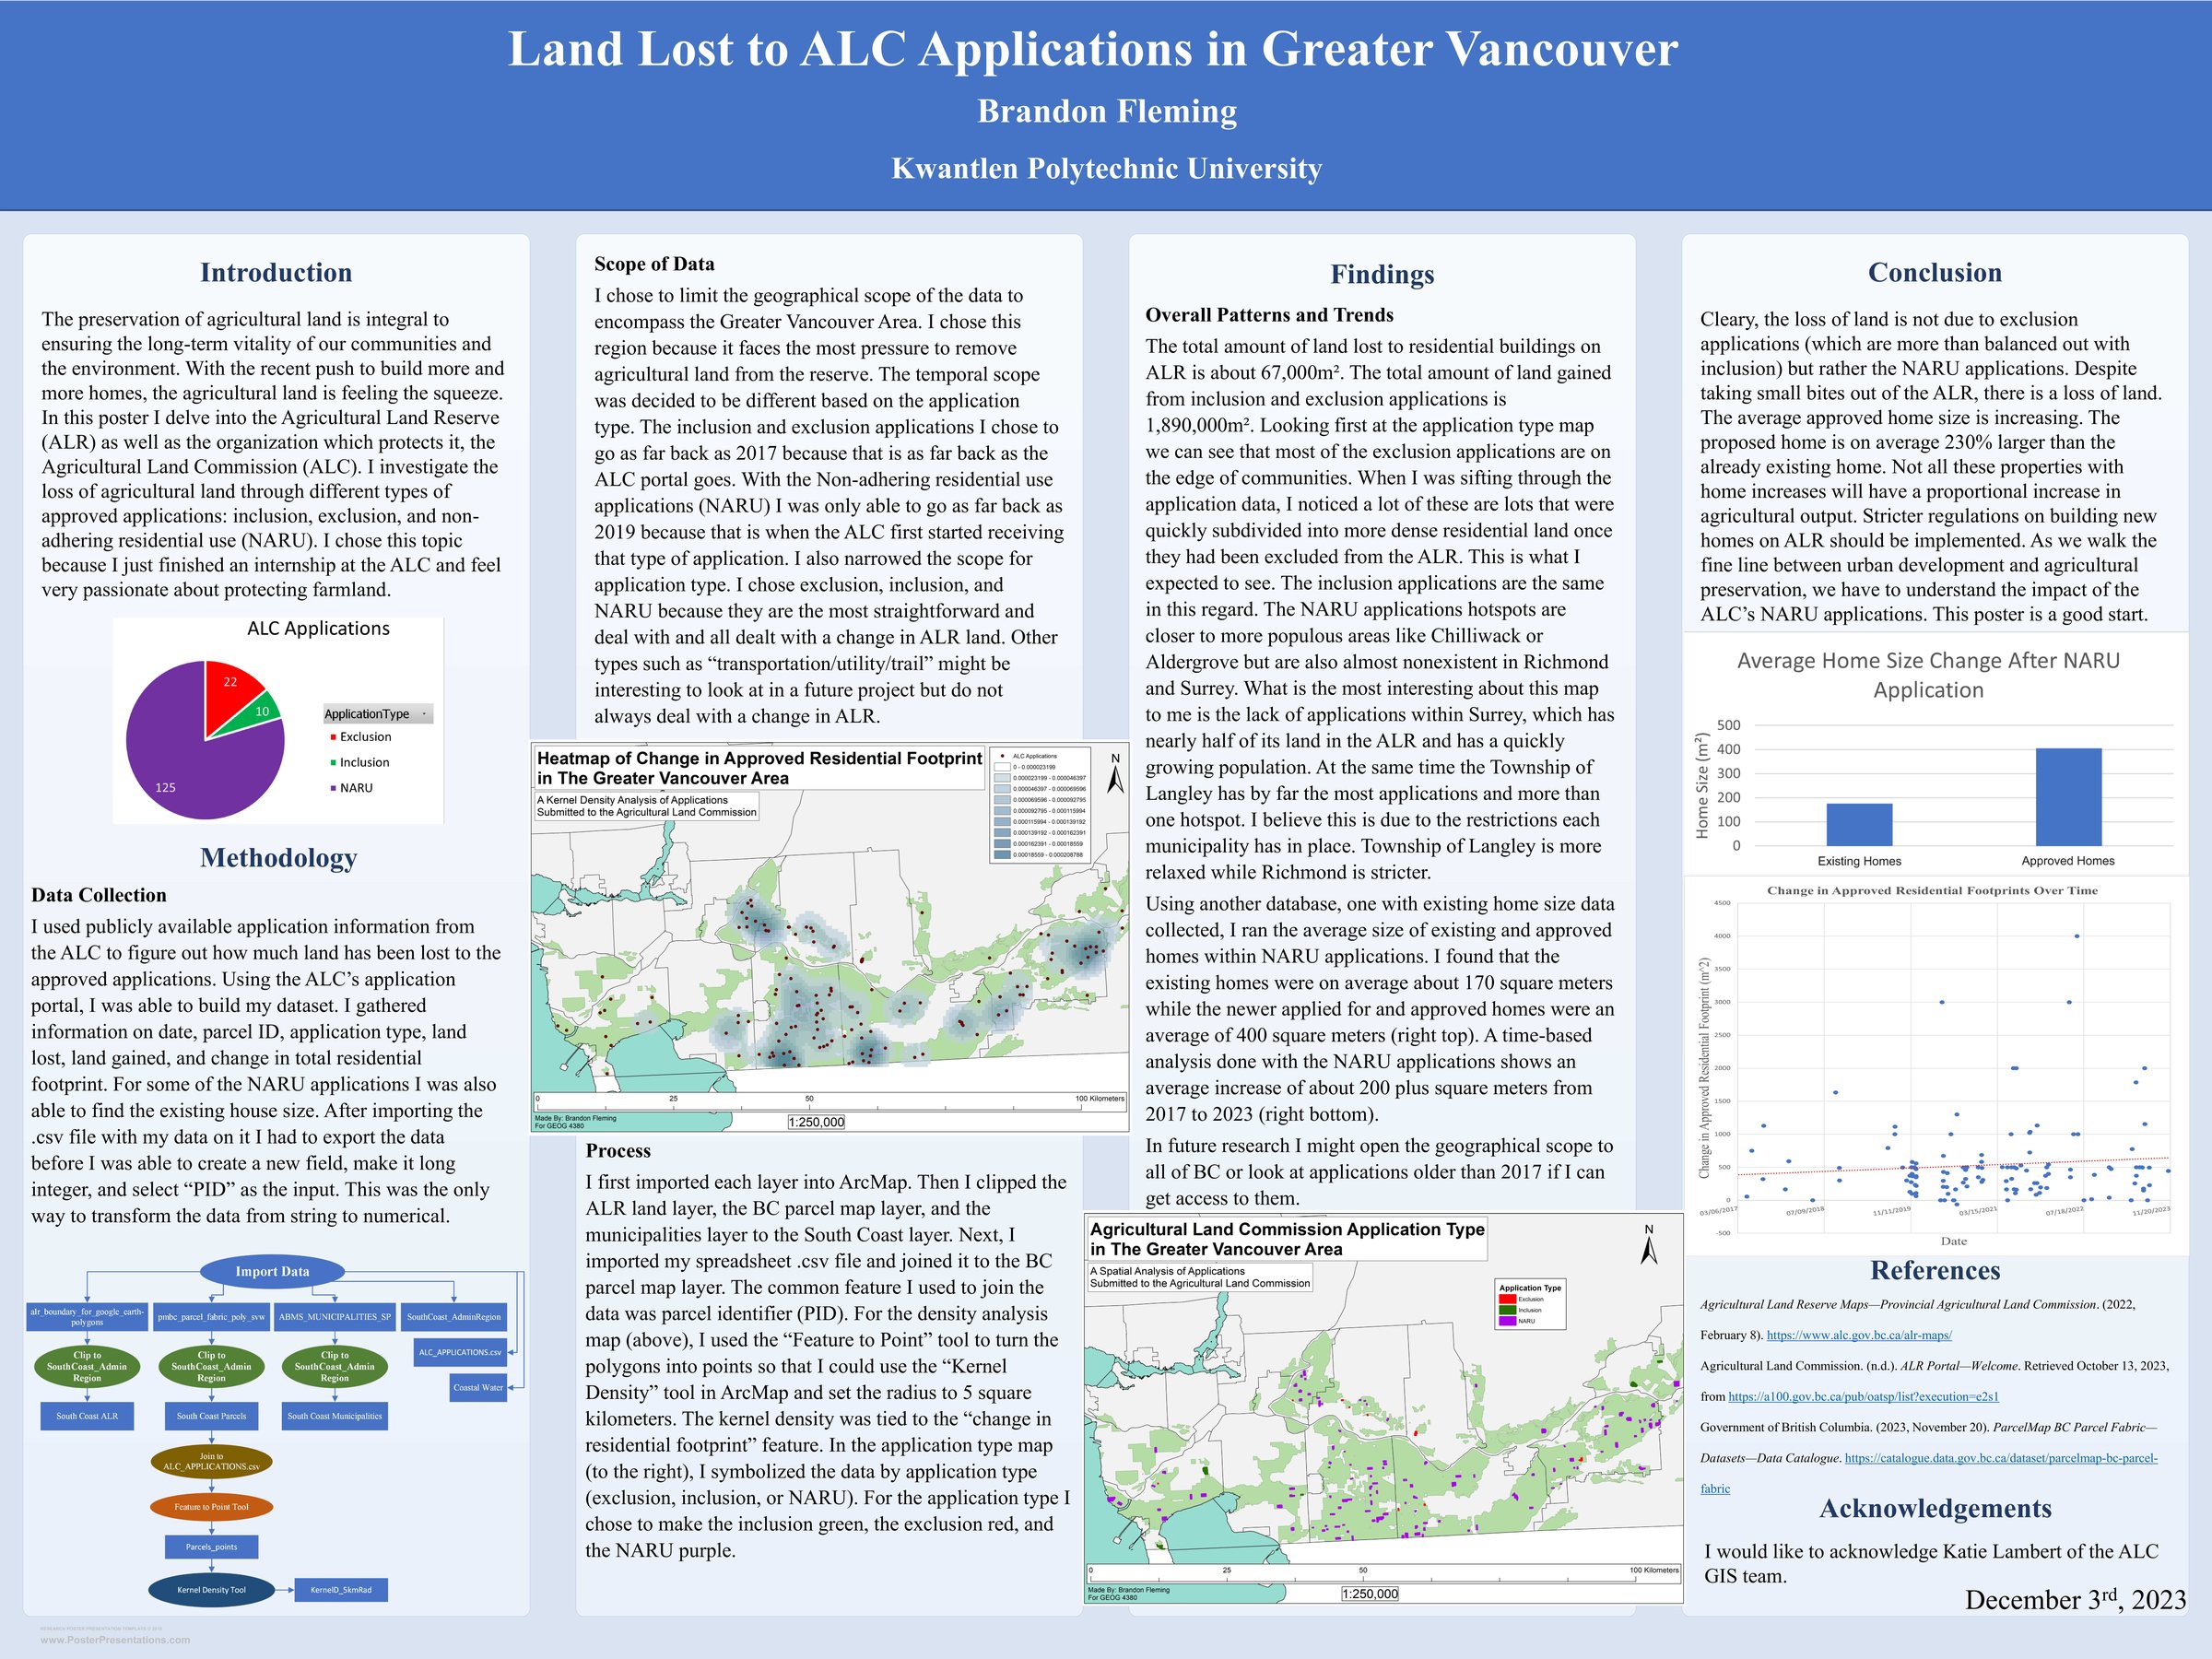
I built the dataset by hand from the ALC’s public application portal, recording date, parcel ID, application type, land lost, land gained, and change in total residential footprint for 157 applications across the Greater Vancouver area. For a subset of NARU applications I was also able to recover the size of the existing house.
Temporal scope varies by application type, because the records do: inclusions and exclusions go back to 2017 (the limit of the portal), NARU applications to 2019 (when the ALC began receiving that type).
In ArcMap I clipped the ALR boundary, ParcelMap BC parcel fabric, and municipal boundaries to the South Coast region, then joined my spreadsheet to the parcel fabric on parcel identifier (PID). Converting polygons to points with Feature to Point allowed a kernel density surface at a 5 km radius, weighted by change in residential footprint rather than by application count, so the map shows where built area is growing, not merely where paperwork is filed.
What I found
Exclusions were not the story. Inclusion and exclusion applications together produced a net gain of roughly 1,890,000 m² of ALR land. Meanwhile approved residential buildings consumed about 67,000 m², small in absolute terms but moving in one direction only, and never coming back.
The houses are getting much bigger. Within NARU applications, existing homes averaged about 170 m². The homes applied for and approved averaged about 400 m², roughly 230% larger than what they replaced. A time series across the application record shows the approved footprint increasing by 200-plus square metres between 2017 and 2023.
The geography follows municipal permissiveness, not development pressure. NARU hotspots cluster near Chilliwack and Aldergrove, and the Township of Langley has by far the most applications with more than one hotspot. Richmond and Surrey are nearly absent, despite Surrey having close to half its land in the ALR and one of the fastest-growing populations in the region. The most plausible explanation is regulatory: Langley’s local restrictions are comparatively relaxed where Richmond’s are strict.
Why it matters
Land removed from the ALR through exclusion is visible, contested, and politically expensive. Land consumed by an approved 400 m² house on land that remains nominally agricultural is none of those things, and it is not obviously accompanied by any increase in agricultural output.
If the goal is preserving farmland, the ALC’s NARU stream deserves the scrutiny currently spent on exclusions, and stricter regulation of new residential construction on ALR land is the more direct lever.
Limits and next steps
The geographic scope is Metro Vancouver only, and the temporal scope is bounded by what the public portal exposes. Extending to all of BC, or obtaining pre-2017 records directly, would test whether the Langley/Richmond contrast holds province-wide. I’d also want to pair footprint change with agricultural productivity data, which this analysis does not attempt.
Thanks to Katie Lambert of the ALC GIS team.
Download the poster (PDF) Print resolution
Data & sources
- ALC Application Portal, Agricultural Land Commission
- ParcelMap BC Parcel Fabric, Government of British Columbia
- Agricultural Land Reserve Maps, Provincial Agricultural Land Commission